Pivot tables are used for handling, arranging or summarizing large amounts of data. It collects individual terms of an extensive table. In Excel, we create a pivot table for a range of cells.
Pivot tables are one of the most useful features of Excel. It can be used to manipulate data for our own convenience. Pivot tables have different features and they can be used accordingly.
Related: Create a PivotTable.
Why Pivot Tables?
- Easy to use.
- Helps find Data patterns.
- Gives Concise data report.
- Time saving.
Pivot Tables are helpful for large amounts of data. It can help see Data patterns and decision making. They can be time saving. Instead of separating rows or columns one by one, we can use pivot tables.
We can use standard tables, but they have a very limited functions as compared to a Pivot tables. Using Standard tables we can filter the data, and take a quick look at our data.
From the image, we can see that how we may summarise or reorganise the data without deleting any information from the data set.
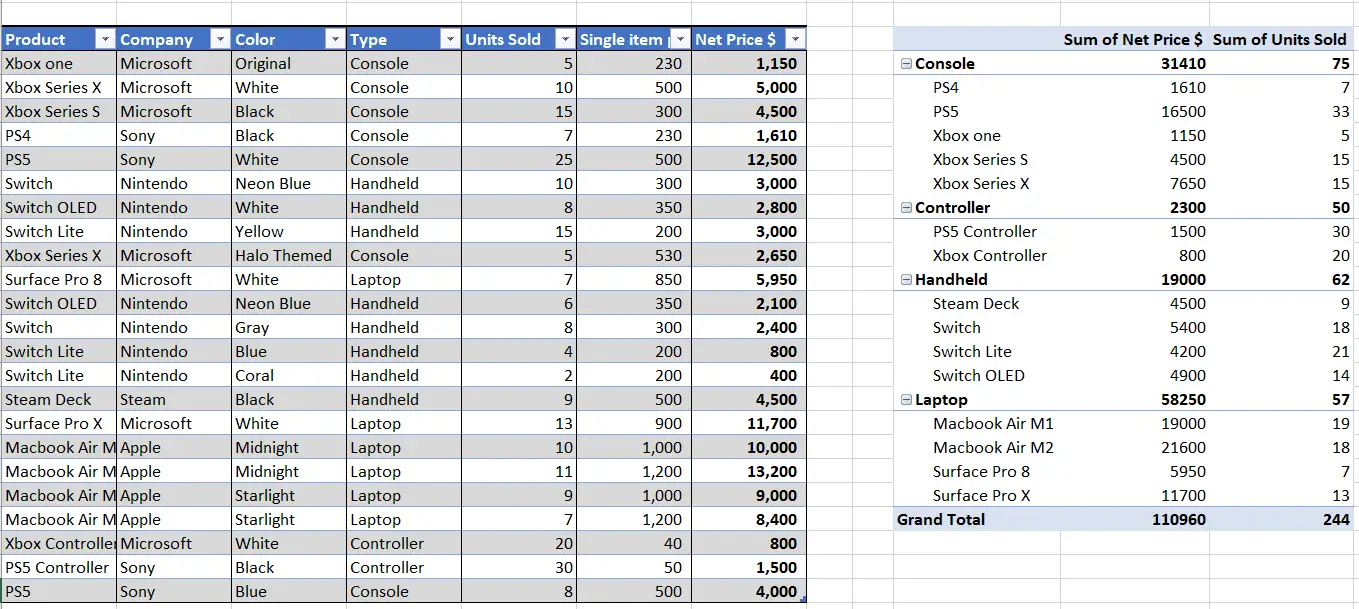
In case of pivot tables, we can summarize the data to our liking. In pivot table, we can filter the data much more efficiently as compared to a Standard table.
Uses of Pivot Table
Following are the features of Pivot tables.
- Analysing large amounts of data.
- User Friendly.
- Transforming rows into columns and vice versa.
- Filtering data.
- Adding Pivot Charts to the data.
- Sorting and Conditionally formatting the data.
- Summing, taking Average, and Counting the data more easily.
- Presenting Concise data.
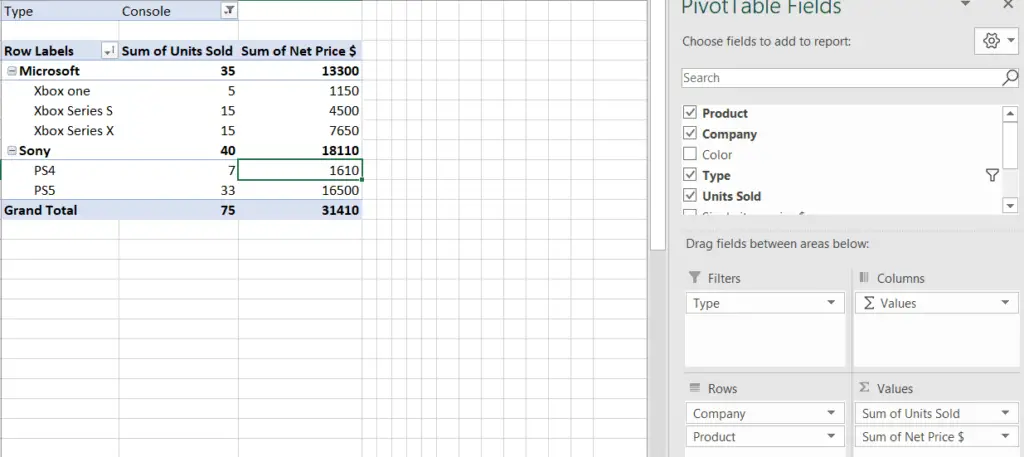
The data may be sorted according to the requirement. We can analyse how do different products are being sold as compared to one another.
Pivot Charts
PivotCharts are the visual representation of the Pivot table data. Pivot charts are linked with Pivot tables, any changes to the Pivot Table will affect the Pivot Charts. They are very helpful in analysing the data. Pivot charts have all the features of a standard chart, we can choose what type of pivot chart we want.

Using Pivot Table
It is a good idea to use Pivot table on a large set of numbers, that data will be difficult to analyse when we are specifically looking for a small range of data. This is where pivot tables becomes important.
Remember that, for making a Pivot table, it is necessary to have a range of cells with data. And a pivot table is made on this data.
In the image below, we see a set of data that can be summarized using Pivot Table.
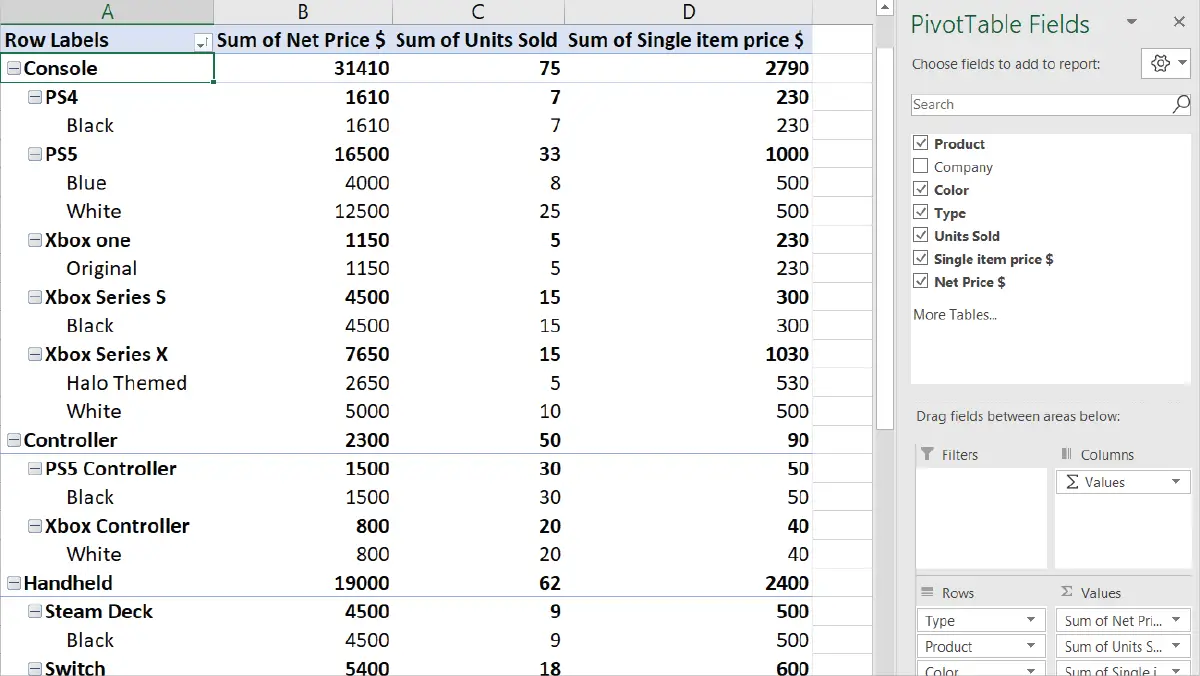
Pivot Table fields
This section is divided between fields and areas. We put the fields in the area to add data in the pivot table.
Image
We can summarize our data using the following features.
- Rows
- Columns
- Values
- Filters
Rows and Columns
In Rows and Columns, we add data that we need to analyse.
Values
In Values, we determine how to analyse the data, we can add them, count them or calculate average.
Filters
By using Filters it is possible to analyse filtered data.
In short, we can say that a pivot table may be used for different wide range of purposes. It is a time saving tool that summarises data and helps in Decision making.
More on PivotTable:
2 replies on “What is a Pivot table in Excel”
[…] In this tutorial, you will learn how to create a Pivot Table, click here if you want to know What is a Pivot Table. […]
[…] Slicers can only be used on a Table or a PivotTable, if you do not have either of those, click here to learn about PivotTables. […]