Categories
Excel

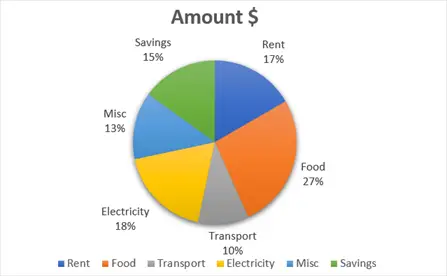
Make a Pie chart in Excel

In this tutorial, we will learn how to make a Pie chart in MS Excel. Pie chart is used to show the distribution of a data. It is in the form of a circle and is divided into slices to show numerical proportion. MS Excel 2021 is used.

Categories
Excel

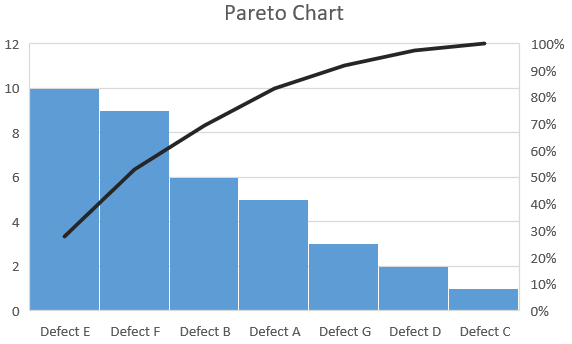
Make a Pareto chart in MS Excel

Pareto chart is the combination of bar chart and line chart. The bar graph represents a values in descending order while line graph represents cummulative total of the values. MS Excel 2021 is used.

Categories
Excel

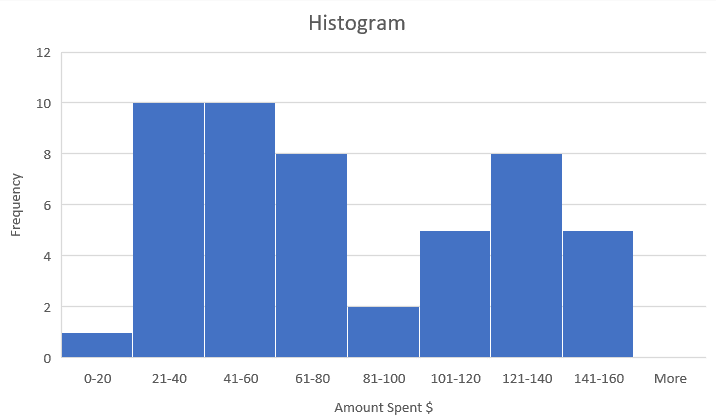
Make a Histogram in Excel

In this tutorial, we will learn how to make a Histogram in Microsoft Excel. Histogram is used to represent a distribution of data. We will use numerical data to make a Histogram chart. MS Excel 2021 is used.

Categories
Excel

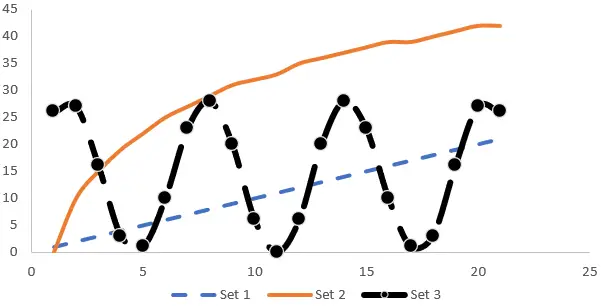
How to change the format of lines on a chart in MS Excel

In this tutorial, you will learn how to change the format of lines on a chart, so lines can be distinguished by Color, Dash type and Markers.

Move Camera in Blender Ice-Cream cone in Blender Make Random numbers in Excel Earthquake animation in Blender Filter using Slicer in Excel