
In this tutorial, we will create a PivotChart using a PivotTable. It can be used to display data of a PivotTable. PivotCharts are a great way to visualize data on a PivotTable. Microsoft Excel 2021 is used.
To make a PivotChart, we need to have a PivotTable first, click here to learn about PivotTable.
PivotChart type
The following chart types cannot be used in PivotCharts.
- Scatter Chart or XY Chart
- Stock Chart
- Map Chart
- Bubble Chart
- Tree Map Chart
- Histogram Chart
- Box & Whisker Chart
- Waterfall Chart
- Sunburst Chart
- Funnel Chart
All other Charts can be made using PivotChart.
Making a PivotChart
For this tutorial, we are using the PivotTable that was made in previous tutorial.
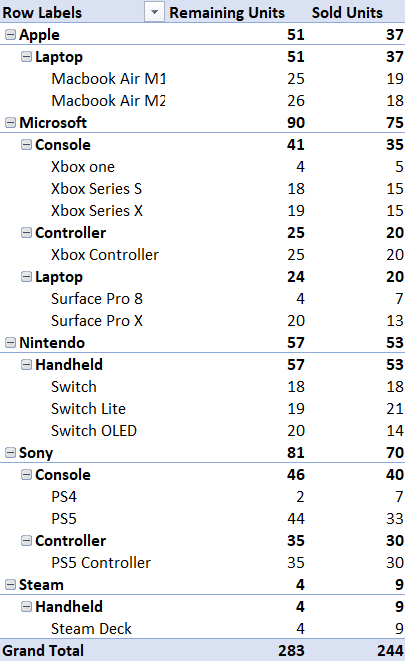
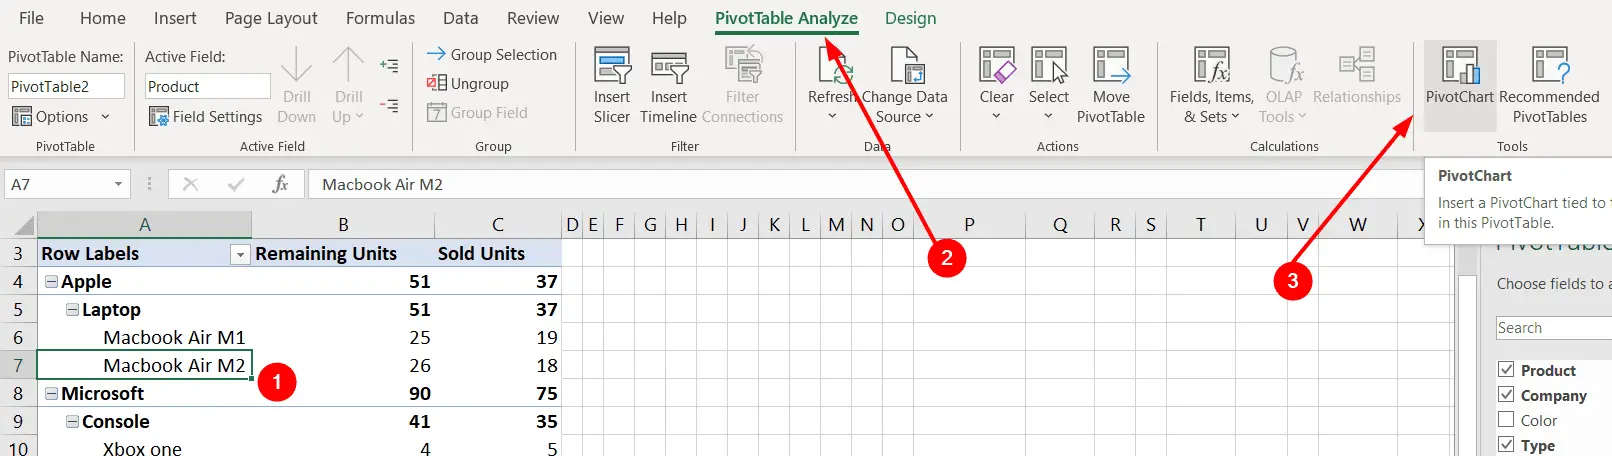
To make a PivotChart, select any cell of the PivotTable, and click PivotTable Analyze from the ribbon, and click PivotChart.
A menu will appear, select the chart, that you want to make.
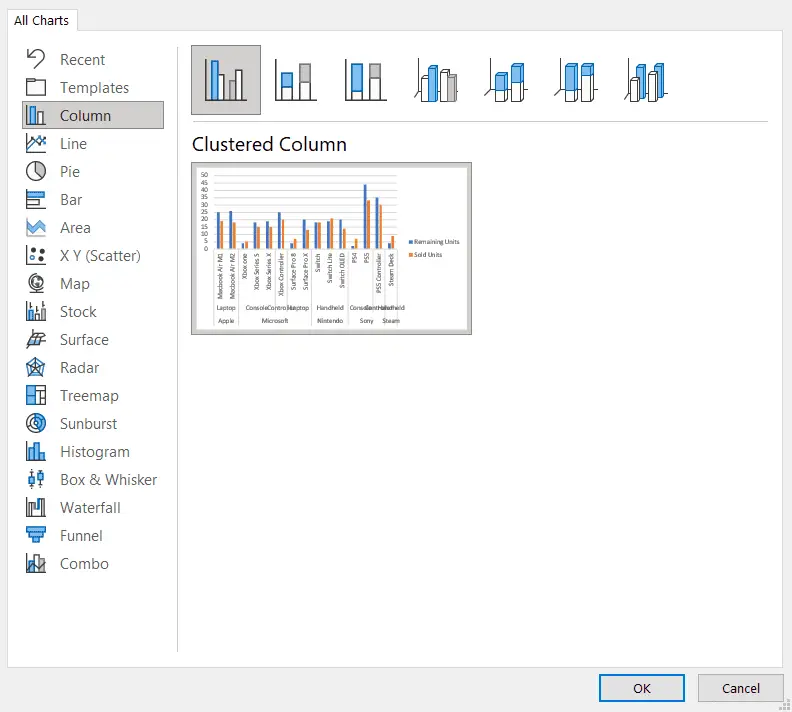
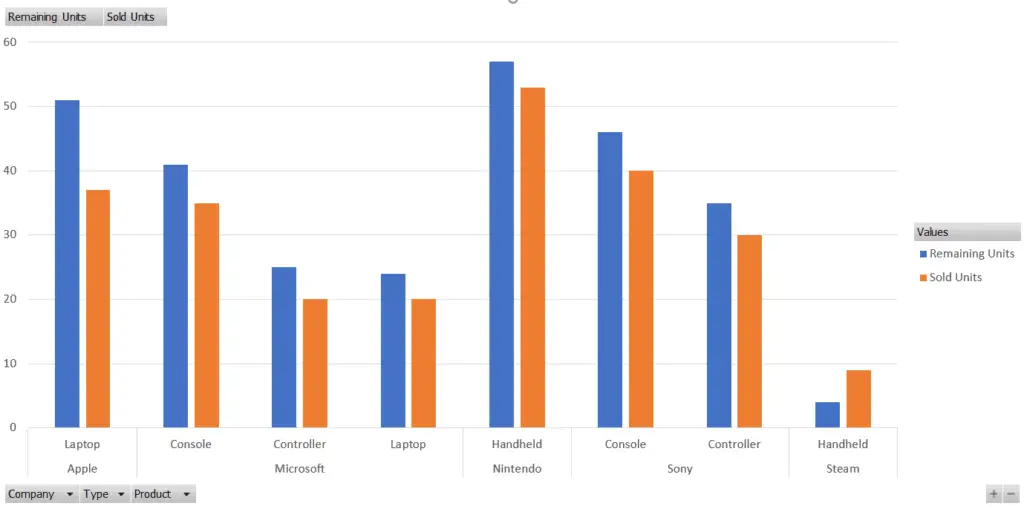
We have selected a Clustered Column chart for this tutorial.
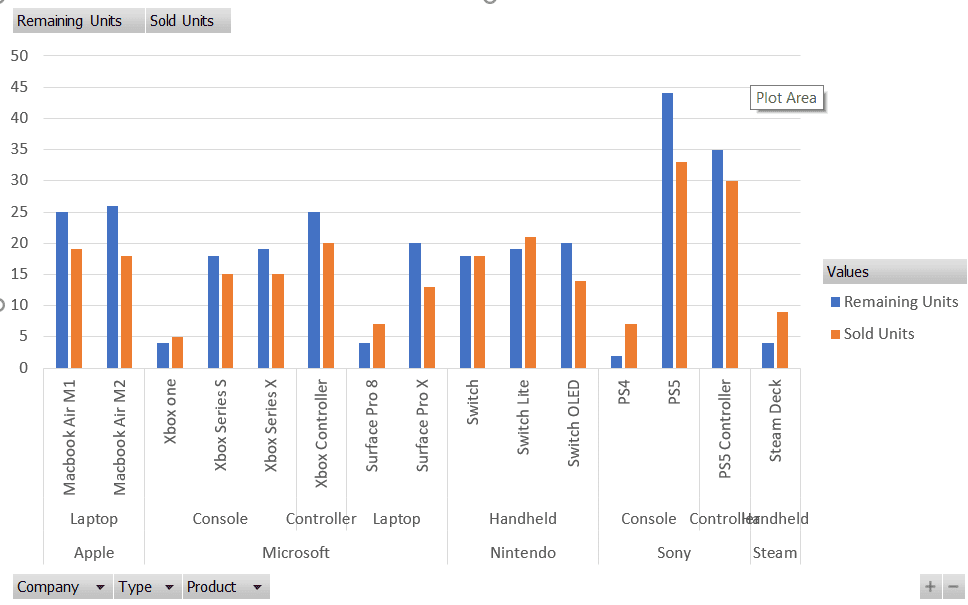
As it can be seen that a PivotChart shows the information in a more detailed manner as compared to a standard chart. Moreover, we can expand or collapse the fields and we can sort the PivotChart.
Using the PivotChart
Two functions can be done using PivotCharts.
- Sort PivotCharts
- Expand or Collapse PivotCharts.
Sort PivotCharts
PivotCharts can be sorted using Row Labels, click on Row Labels located on the bottom left corner of the chart to sort the PivotChart.
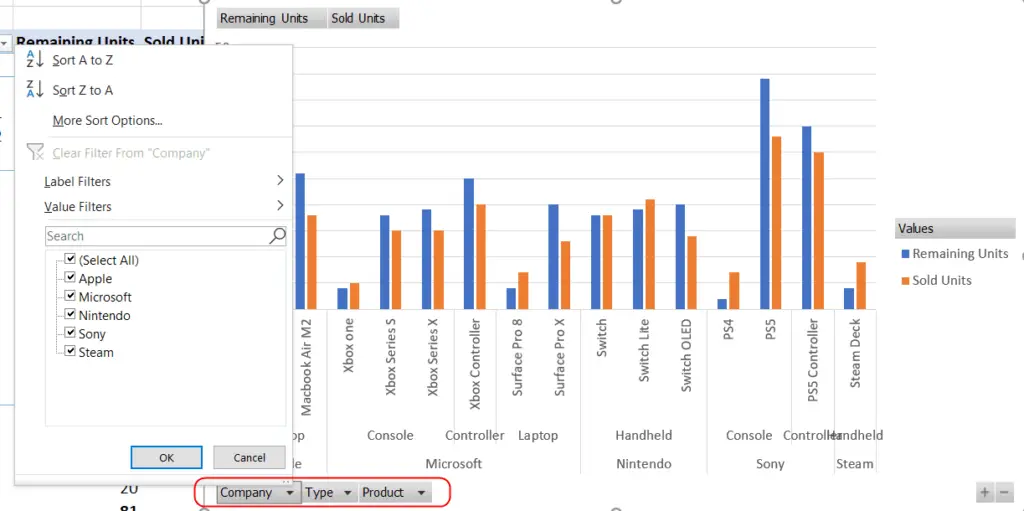
Row Labels can be used to sort the PivotChart.
Expand/Collapse PivotChart
The fields can be collapsed or expanded using the PivotTable, click the + - buttons on bottom right corner of the PivotChart.
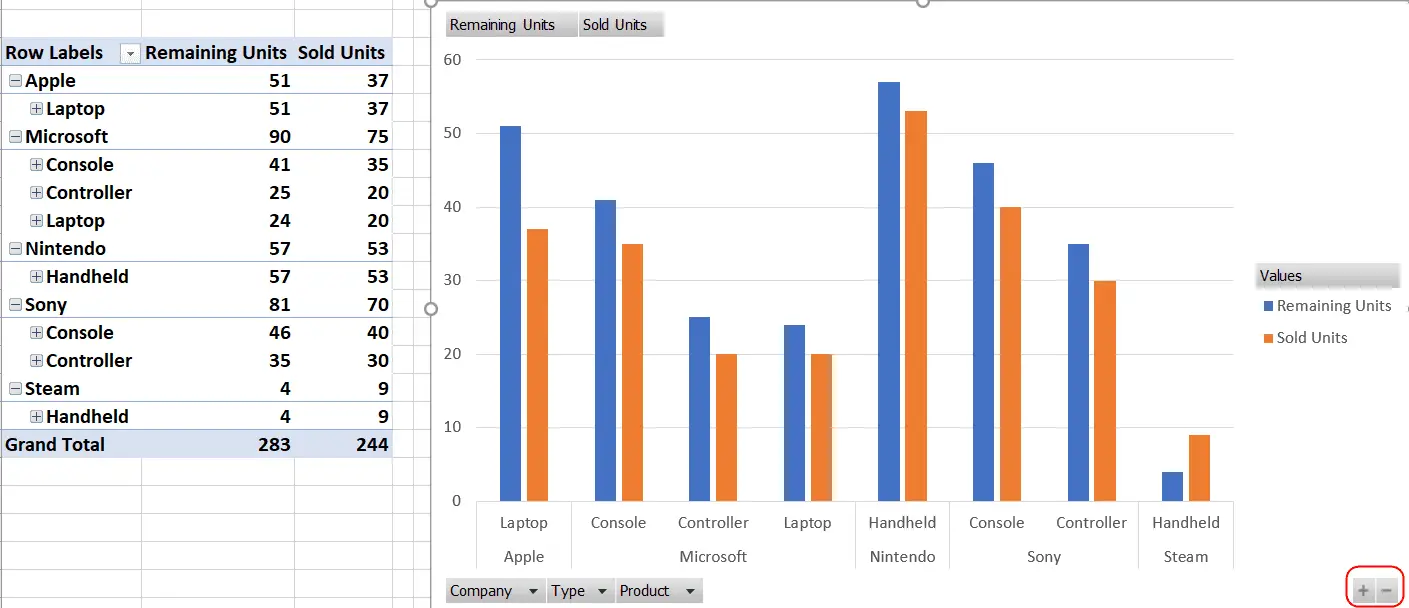
Expanding or Collapsing the PivotChart also affects the Fields in PivotTable.
PivotTables and PivotCharts are associated with each other. PivotChart cannot be created without a PivotTable.
More on PivotTables: