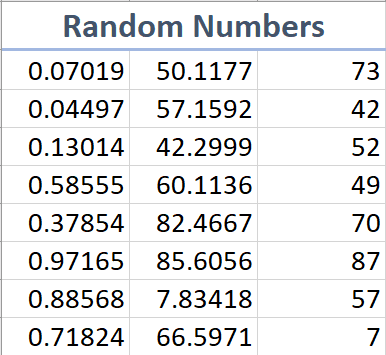
In this tutorial, we will learn how to generate random numbers in Excel. RAND() and RANDBETWEEN() can be used to generate random numbers. MS Excel 2021 is used. For this tutorial, we will be using RAND function and RANDBETWEEN function. RAND() :This function returns a random real number between 0 and 1. RANDBETWEEN(bottom, top): This […]
Category: Excel
How to use IF function in Excel
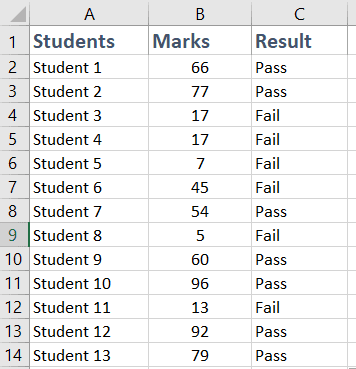
In this tutorial, we will learn how can we use IF condition in excel. IF function is one of the logical functions in MS Excel. This function returns the result either True or False based on a condition. MS Excel 2021 is used.
Make a Pie chart in Excel
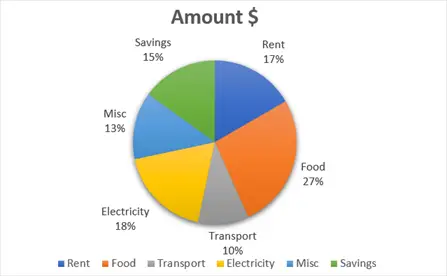
In this tutorial, we will learn how to make a Pie chart in MS Excel. Pie chart is used to show the distribution of a data. It is in the form of a circle and is divided into slices to show numerical proportion. MS Excel 2021 is used.
Make a Pareto chart in MS Excel
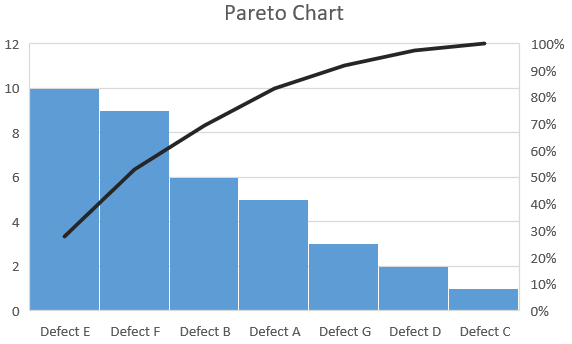
Pareto chart is the combination of bar chart and line chart. The bar graph represents a values in descending order while line graph represents cummulative total of the values. MS Excel 2021 is used.
Make a Histogram in Excel
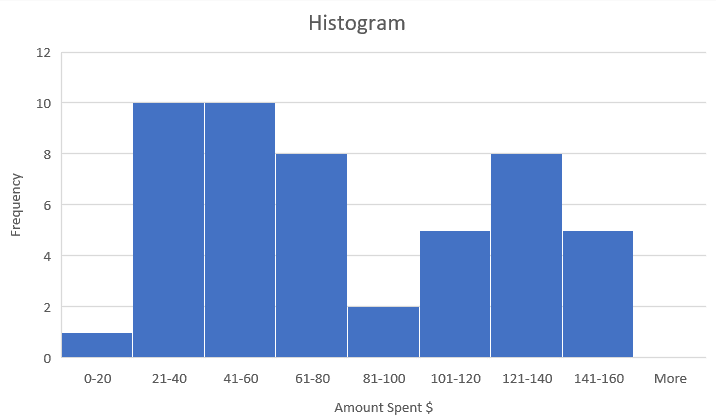
In this tutorial, we will learn how to make a Histogram in Microsoft Excel. Histogram is used to represent a distribution of data. We will use numerical data to make a Histogram chart. MS Excel 2021 is used.
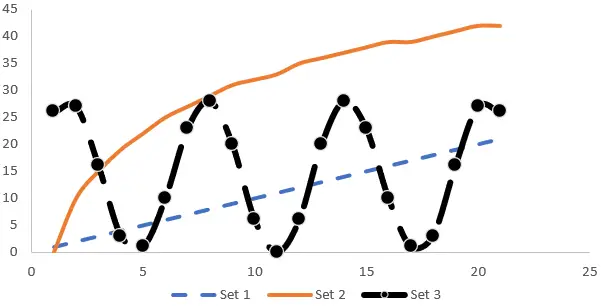
In this tutorial, you will learn how to change the format of lines on a chart, so lines can be distinguished by Color, Dash type and Markers.